Sedenius Signal Plot Components
Increase your productivity with smart extensions for ROS and ADTF
PRODUCTS
Sedenius Signal Plot Components
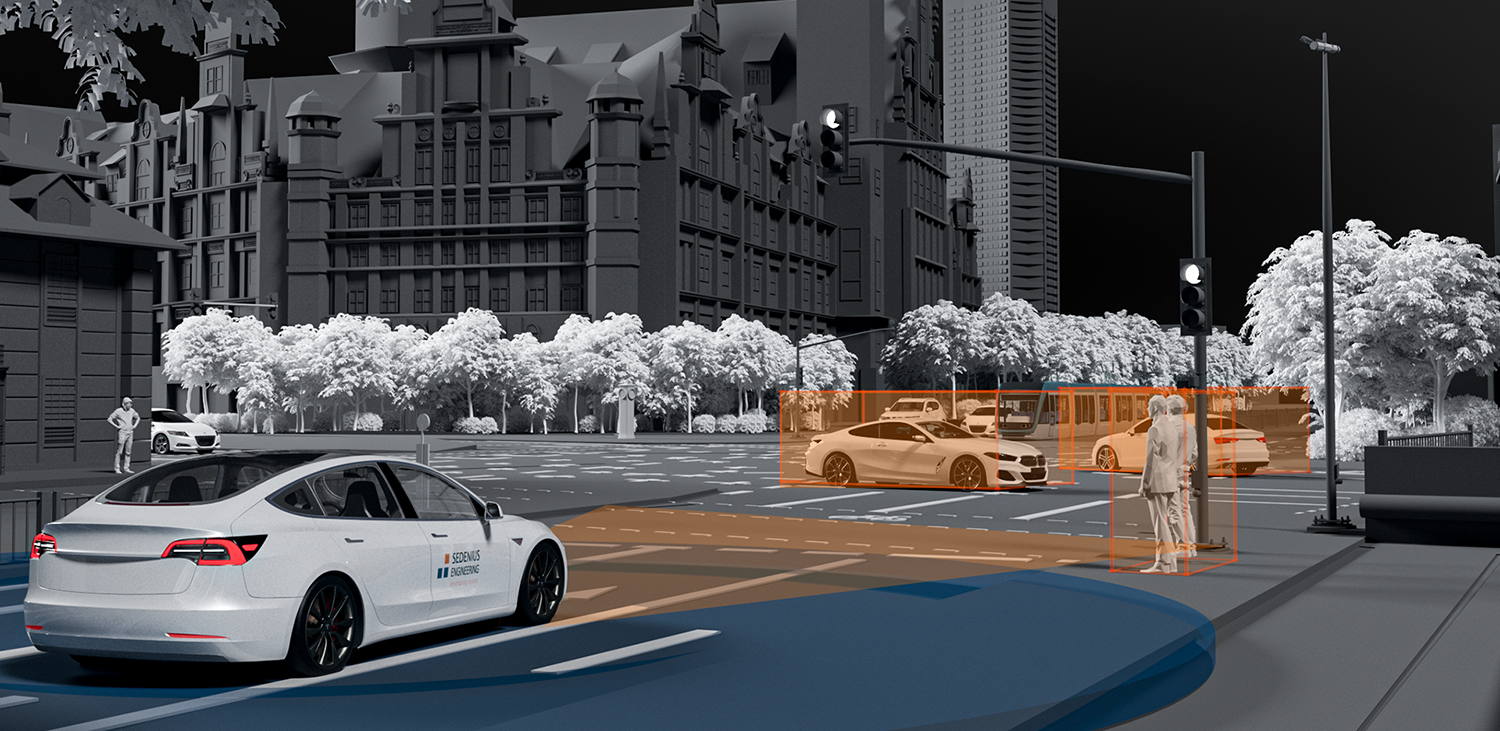
Our Sedenius Signal Plots Components offer you the possibility to clearly visualize technical data in the vehicle. This makes them the ideal tool for troubleshooting and detecting irregularities. In addition to a graph-based display, sophisticated tools for difference measurement and frequency analysis are available to all integration engineers.
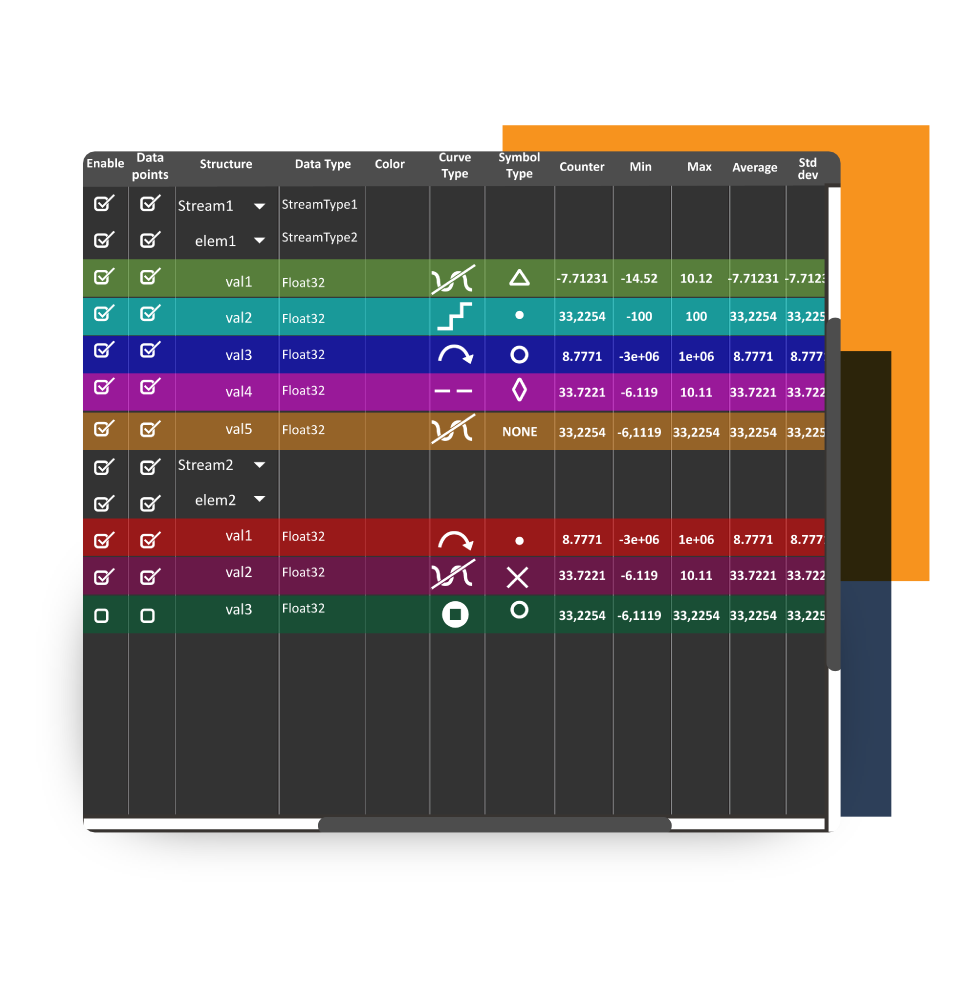
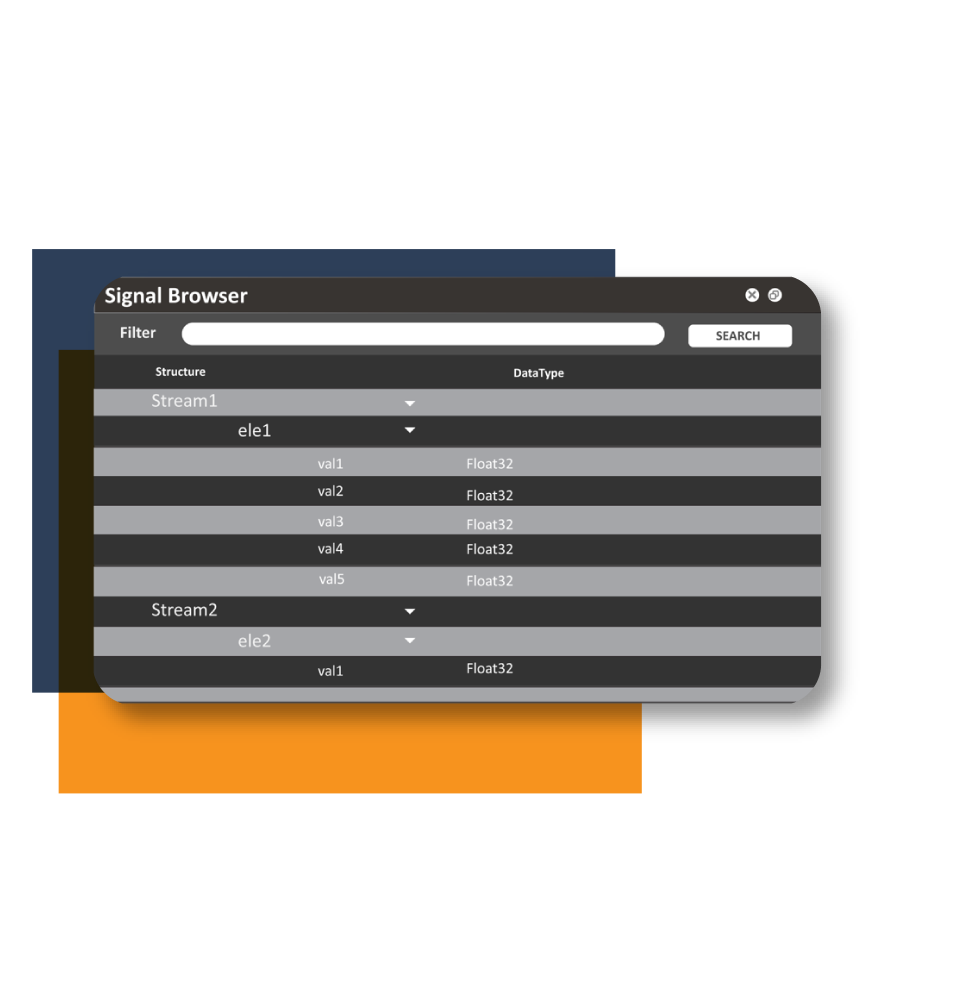
With the Signal Browser you can keep track of all signals to be monitored. Our Signal Monitor allows the clear visualization and monitoring of selected signals in the Treeview. In addition, statistical values such as average, minimum and maximum are displayed. The Signal Plot component is a tool that makes signal paths visible. In addition, it has sophisticated functions such as horizontal and vertical zooming and automatic scaling as well as various inspection tools. Keep every detail in view with Sedenius Signal Plot Components.
Technical data:
- Signal Browser with search function for selecting signals
- Support of any signal source through interface design
- Support of nested signals/structures
- Signal Monitor for statistical evaluation of signals, support of user-defined functions at run time (Min, Max, Average, Counter, Last Value)
- Signal Plot displays the curve of selected signals over time
- Table View with enum support
- Histogram Plot
- Combination with other ROS and ROS2 components possible
- Cpp library can be easily integrated into other applications e.g. ADTF2 or ADTF3
- Signal Plot displays the curve of selected signals over time
- Auto Forward
- Zoom Function / Auto Zoom
- Inspection Tool and Difference Selection Tool for the analysis of signal values and times
- Different Curve Styles
- Multiple Vertical AxisDifferent Curve Styles

FEATURES
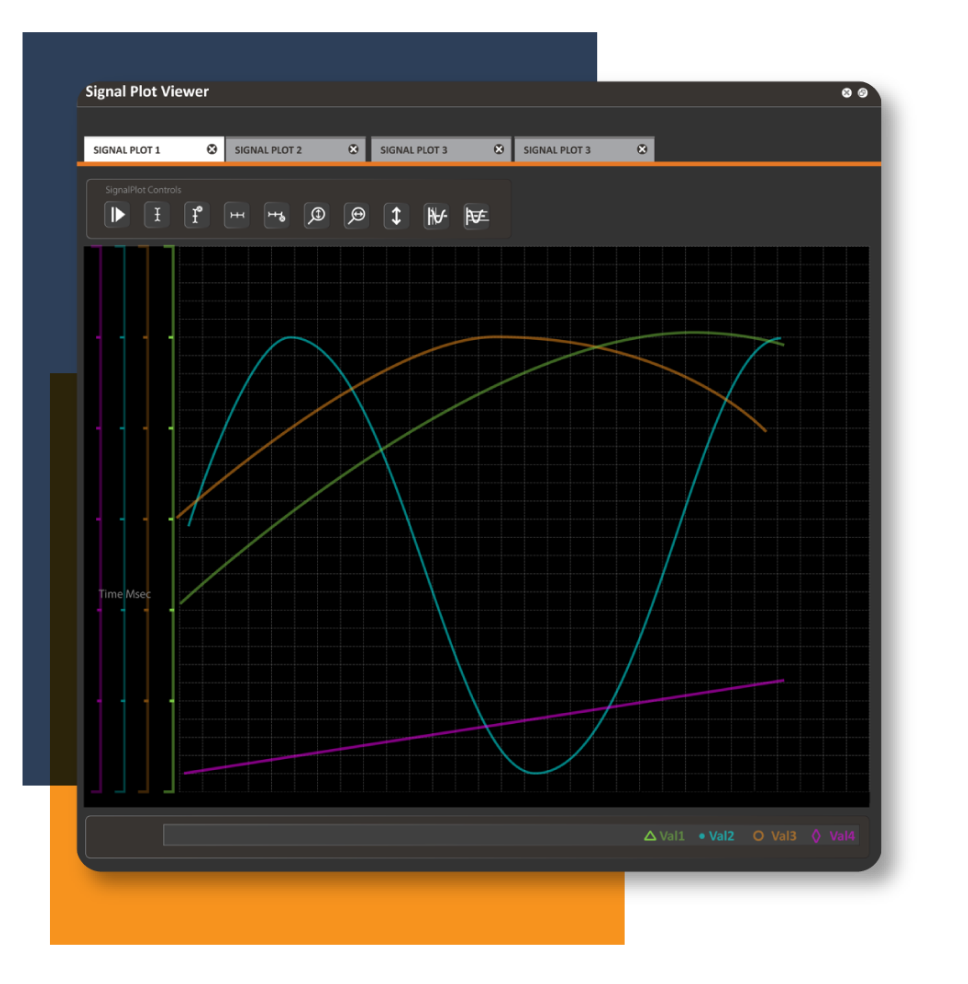
Sedenius Signal Plot Viewer
- Plug-in solutions for SomeIP, FlexRay and CAN or CAN-FD bus systems
- Support of any signal sources through interface design
Sedenius Signal Plot Monitor
Signal monitor for statistical evaluation of signals, support of user-defined functions during runtime
Sedenius Signal Plot Browser
- Signal browser as tree view with search function for the selection of signals
Sedenius Signal Plot Components: Insights
Explore Sedenius Signal Plot Components in our short product video. Learn concisely and visually how these components can enhance your signal management.